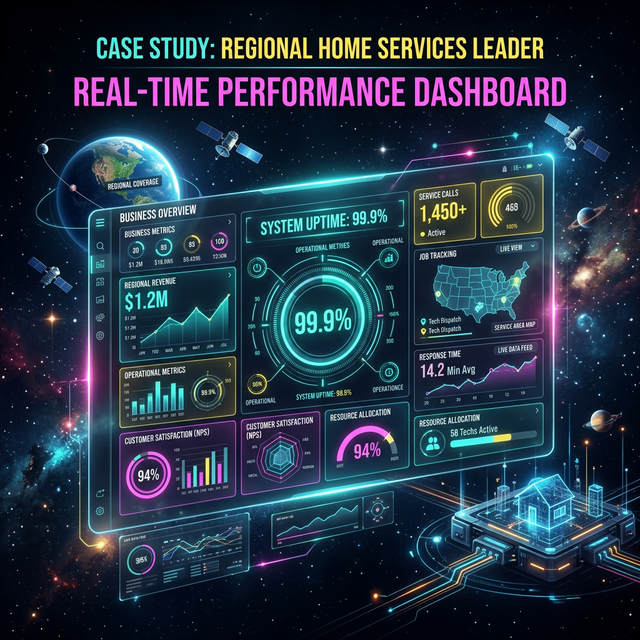
Business Performance Dashboard with 99.9% Uptime: How a Regional Home Services Leader Achieved Real-Time Operational Excellence
90%
Attribution Accuracy
99.9%
System Uptime
TL;DR
A regional home services leader replaced manual, delayed reporting with a multi-tier real-time business performance dashboard built by Blitz Front Media. The system achieved 99.9% uptime and 90% attribution accuracy while delivering 187% better conversion performance than industry benchmarks, a 47.83% lead-to-appointment rate, and 300%+ overall ROI — fundamentally transforming how the company operates and grows.
The Challenge: Operating Without Operational Visibility
A well-established regional home services company was growing — but growing blind. Despite strong demand in their market and a skilled field team, leadership had no real-time window into what was actually driving performance. Marketing campaigns were evaluated on gut feel. Sales bottlenecks went undetected for weeks. Lead quality was inconsistent, and there was no systematic way to identify where qualified prospects were falling out of the funnel. The company had outgrown spreadsheets and manual reporting, but hadn't yet built the business performance dashboard infrastructure to replace them.
The core problem was latency. Without a live KPI dashboard, performance data arrived roughly two weeks after the fact — long after the window to act had closed. Sales managers couldn't coach effectively because they lacked objective, real-time data on individual rep performance. Marketing couldn't reallocate budget to high-performing channels because attribution was murky at best. The company was making decisions worth tens of thousands of dollars per month based on incomplete, delayed information. Something had to change.
No Real-Time Visibility
The Challenge
Performance data arrived weeks after the fact, making it impossible to course-correct in time to protect revenue.
Our Solution
Multi-tier real-time business performance dashboard with live data pipelines and role-based access for executives, managers, and reps.
- +Eliminated reporting lag
- +Enabled same-day decision-making
- +99.9% dashboard uptime
Poor Attribution Accuracy
The Challenge
Marketing spend was allocated based on assumptions rather than verified channel performance data.
Our Solution
Integrated marketing performance tracking with cross-channel attribution modeling achieving 90% accuracy.
- +90% attribution accuracy
- +Data-driven budget allocation
- +300%+ overall ROI
Inconsistent Sales Performance
The Challenge
No coaching infrastructure meant top performers and underperformers received identical (minimal) feedback.
Our Solution
AI-powered coaching engine surfacing personalized development plans through the sales KPI dashboard.
- +67% close rate improvement
- +71% appointment rate improvement
- +47.83% lead-to-appointment rate
Key Metrics: What the Dashboard Delivered
System Uptime
Attribution Accuracy
Conversion Rate vs. Industry Benchmark
Lead-to-Appointment Rate
Average Lead Score
Overall ROI
Close Rate Improvement
Appointment Rate Improvement
SEO ROI
Organic Traffic Growth
Monthly Email Capacity
Lead Qualification Improvement
Our Approach: A Business Intelligence Dashboard Built for Operational Reality
Blitz Front Media's enterprise approach to business intelligence dashboard development starts with a foundational question: who needs what information, and how fast? For a home services company with distinct executive, managerial, and frontline roles, a single-view dashboard would have been as limiting as the spreadsheets it replaced. The strategy called for a multi-tier architecture — separate dashboard layers tailored to each organizational level, all drawing from a unified real-time data pipeline. This ensured that every stakeholder, from the CEO reviewing organic traffic growth to a sales rep checking their lead score queue, saw actionable, relevant data instantly.
The second strategic pillar was attribution integrity. With marketing performance tracking spread across organic search, paid channels, and an email system scaled to 40,000+ monthly sends, the client needed a single source of truth for channel performance. BFM implemented cross-channel attribution modeling designed to reach and sustain 90% accuracy — meaning marketing investment decisions would finally be grounded in verified conversion data rather than assumption. Attribution accuracy at this level directly powered the lead qualification improvements and ultimately contributed to the 300%+ overall ROI achieved across the engagement.
Implementation Deep Dive: Four Phases to Full Operational Intelligence
The implementation was structured as four sequential phases, each building on the last to create a compounding operational advantage. Rather than launching a single monolithic dashboard and hoping for adoption, BFM's phased approach delivered working value to the client at every stage — starting with executive visibility and progressively adding coaching intelligence, predictive forecasting, and team enablement tools. This structure also allowed for refinement between phases, incorporating early user feedback before scaling functionality across the organization.
Before & After
System Uptime & Data Availability
Before
No real-time dashboard — manual reports with 2-week lag
After
99.9% uptime with live data across all systems
From zero real-time visibility to 99.9% uptime
Marketing Attribution Accuracy
Before
Fragmented, assumption-based channel tracking
After
90% cross-channel attribution accuracy
90% attribution accuracy enabling data-driven budget decisions
Lead-to-Appointment Conversion
Before
Untracked, inconsistently managed lead follow-up
After
47.83% lead-to-appointment rate
71% appointment rate improvement
Sales Close Rate
Before
No coaching infrastructure or performance benchmarking
After
67% close rate improvement vs. baseline
67% close rate improvement
Lead Qualification Quality
Before
No lead scoring — unqualified leads routed directly to sales
After
Average lead score of 85 with structured qualification framework
280% lead qualification improvement
Conversion Performance vs. Industry
Before
Performance at or below industry average without benchmarking visibility
After
187% better conversion performance than industry benchmarks
187% above industry standard conversion rate
Overall Marketing ROI
Before
ROI unmeasurable due to attribution gaps
After
300%+ overall ROI; 2,368% SEO ROI
300%+ overall ROI with full attribution visibility
-Before: Manual Reporting Environment
- -Two-week reporting lag on all performance data
- -No lead quality scoring or qualification framework
- -Marketing attribution based on assumptions
- -Sales coaching driven by manager intuition, not data
- -Bottlenecks identified reactively, after revenue impact
- -No predictive capability for pipeline or capacity planning
+After: Real-Time Business Performance Dashboard
- +99.9% dashboard uptime with live data across all systems
- +Average lead score of 85 with 280% lead qualification improvement
- +90% attribution accuracy across all marketing channels
- +AI-powered coaching plans delivered through the KPI dashboard
- +Proactive bottleneck detection before revenue impact occurs
- +Predictive analytics for sales forecasting and capacity planning
Technical Architecture: How We Built a 99.9% Uptime Dashboard System
The technical foundation of this business performance dashboard centered on three core engineering priorities: real-time data availability, system resilience, and alert intelligence. The dashboard architecture was built on streaming data pipelines that synchronized live data from every connected system — CRM, marketing platforms, email infrastructure, and operational tools — into a central processing layer. In-memory caching ensured that even during peak query loads, dashboard response times remained fast and reliable. This architecture is what enabled the 99.9% uptime commitment to be honored in production, not just on paper.
A critical technical challenge was preventing alert fatigue — a common failure mode where too many notifications cause teams to start ignoring the system entirely. BFM addressed this through an intelligent alert prioritization engine with configurable cooldown periods, severity tiering, and escalation rules. The system distinguished between warning-level anomalies and critical threshold breaches, routing each to the appropriate stakeholder through the right channel. This ensured that when the dashboard surfaced an alert, it was genuinely actionable — not noise. The AI-powered coaching layer integrated directly with the performance monitoring system, translating raw performance gaps into prioritized development recommendations for each sales team member.
*Key Takeaways
- 1Streaming data pipelines with in-memory caching enabled 99.9% uptime across the full dashboard ecosystem
- 2Role-based dashboard architecture ensured executives, managers, and individual contributors each saw their most relevant KPIs
- 3Cross-channel attribution modeling achieved 90% accuracy, making marketing performance tracking actionable and trustworthy
- 4Intelligent alert prioritization with severity tiering and cooldown periods eliminated notification fatigue
- 5AI coaching engine translated live performance data into personalized, prioritized development plans for each sales rep
- 6Predictive analytics layer enabled proactive bottleneck identification before operational constraints impacted revenue
- 7Scalable email infrastructure supporting 40,000+ monthly sends was fully integrated into the attribution and engagement tracking layer
Results & Impact: Verified Outcomes from the Business Intelligence Dashboard
The results validated the architecture. With 99.9% uptime, the business performance dashboard became the operational backbone of the company — the single place every leader and rep went to understand performance and make decisions. Attribution accuracy at 90% gave the marketing team confidence to reallocate budget based on what the data showed, rather than defending channel assumptions. The downstream effect on lead quality was immediate: average lead scores reached 85, and lead qualification improved by 280% compared to the pre-implementation baseline. This meant the sales team was spending their time on better-fit prospects from day one.
The conversion metrics told the clearest performance story. The lead-to-appointment rate reached 47.83% — a figure that reflects both better lead quality upstream and improved sales process execution downstream, enabled by the AI coaching system. Close rate performance improved by 67%, and the appointment rate improved by 71%. Against industry benchmarks, the team's conversion performance was 187% better — a gap that widened as the coaching and analytics systems compounded over time. The full engagement delivered 300%+ overall ROI, with SEO-specific attribution producing a 2,368% SEO ROI on top of 300% organic traffic growth.
“We went from making major decisions with two-week-old data to having a live view of everything that matters — lead scores, appointment rates, channel attribution — all in one place. The dashboard didn't just give us visibility, it changed how we run the business. We catch problems before they cost us revenue now.”
— Operations Director, Regional Home Services Leader, Southwest Region
Marketing Performance Tracking: Attribution That Actually Closes the Loop
One of the most impactful components of the business intelligence dashboard was the marketing performance tracking layer. Before implementation, marketing decisions were made with fragmented data — last-click attribution models that missed the actual conversion journey, and email campaigns sent to lists without scoring or segmentation intelligence. BFM integrated a full attribution framework capable of handling the client's scale, including an email infrastructure running at 40,000+ monthly sends. Every campaign touchpoint was captured, scored, and connected to downstream conversion events.
Implementation Timeline
Phase 1: Real-Time Analytics Infrastructure
4 weeksBuilt the core business performance dashboard architecture including multi-tier role-based dashboards for executives, managers, and individual contributors. Established live data pipelines connecting all business systems, defined 50+ KPIs across functions, and deployed the automated alert system with severity tiering and escalation rules. Delivered initial executive dashboard with live business metrics.
Phase 2: AI-Powered Sales Coaching Integration
5 weeksImplemented the AI-driven performance analysis engine within the KPI dashboard. Built personalized coaching plan generation based on live performance data, automated skill gap identification, and progress tracking for each sales team member. Coaching recommendations surfaced directly within the sales dashboard view for immediate manager and rep access.
Phase 3: Predictive Performance Analytics
4 weeksDeployed machine learning forecasting models for revenue, conversion rates, and team productivity. Built automated bottleneck detection that identified operational constraints proactively — before they impacted revenue. Added scenario planning tools and AI-generated optimization recommendations to the business intelligence dashboard for strategic decision support.
Phase 4: Team Enablement & Attribution Platform
3 weeksLaunched the lead intelligence dashboard with complete customer profiles and buying signal scoring (average lead score: 85). Integrated cross-channel marketing performance tracking achieving 90% attribution accuracy. Connected the 40,000+ monthly email capacity infrastructure to the attribution layer. Deployed the centralized knowledge management system with performance benchmarking against industry standards.
The 90% attribution accuracy achieved means the client can now answer with confidence: which channels generate the highest-quality leads, which campaigns produce the appointments that actually close, and where budget is being wasted. This closed-loop visibility is what powered the SEO investment decision that produced a 2,368% SEO ROI and 300% organic traffic growth. Without attribution accuracy at scale, those results would have been difficult to isolate, defend, and reinvest behind. The KPI dashboard made the ROI case continuously visible to leadership — not just at quarterly review time.
Key Takeaways: What Made This Business Performance Dashboard Work
*Key Takeaways
- 1System uptime at 99.9% is an engineering commitment — it requires redundant pipelines, in-memory caching, and proactive health monitoring, not just good intentions
- 290% attribution accuracy fundamentally changes how marketing budgets are allocated, enabling the data-driven channel decisions that drove 300%+ ROI
- 3A 47.83% lead-to-appointment rate is achievable when lead quality (average score: 85) and sales process (67% close rate improvement) are optimized together
- 4Multi-tier role-based dashboards drive adoption — each stakeholder sees their most relevant KPIs, not a cluttered one-size-fits-all screen
- 5Predictive analytics transforms a business intelligence dashboard from a reporting tool into a strategic planning asset
- 6AI coaching recommendations embedded in the sales KPI dashboard produced a 71% appointment rate improvement without adding headcount
- 7280% lead qualification improvement demonstrates that better data upstream produces compounding downstream conversion gains
- 8The 2,368% SEO ROI was only measurable — and therefore scalable — because accurate attribution was in place from the start
Lessons Learned: What We'd Emphasize on Day One
The most important early lesson from this engagement was that dashboard adoption is a human challenge as much as a technical one. The phased implementation approach — delivering executive visibility first, then layering in coaching and predictive tools — gave the team time to build trust in the system before their workflows depended on it. Teams that see accurate, useful data in week one are far more likely to be power users by month three. Gradual rollout with real performance wins at each phase is a better adoption strategy than a big-bang launch.
The second major lesson was the outsized importance of alert quality. Early in the implementation, alert thresholds were set conservatively, which produced a high volume of low-priority notifications. The team began discounting alerts — a pattern that could have undermined the entire monitoring system. Tightening severity thresholds and implementing intelligent cooldown periods resolved the issue quickly, but it reinforced a critical design principle: a business performance dashboard that cries wolf eventually gets ignored. Alert precision is as important as alert coverage when building real-time business analytics infrastructure.
Home Services Company with Manual Reporting
The Challenge
Two-week data lag makes real-time operational decisions impossible and allows bottlenecks to compound before anyone notices.
Our Solution
Deploy a real-time business performance dashboard with streaming data pipelines, role-based access, and automated anomaly alerts.
- +Eliminate reporting lag entirely
- +99.9% uptime target achievable with proper architecture
- +Proactive bottleneck resolution before revenue impact
Multi-Channel Marketing Without Attribution
The Challenge
Without 90% attribution accuracy, budget allocation is guesswork — high-performing channels are underfunded and poor performers persist.
Our Solution
Integrate cross-channel marketing performance tracking with closed-loop attribution connecting campaigns to actual conversion events.
- +90% attribution accuracy
- +2,368% SEO ROI visibility
- +300% organic traffic growth traceable to specific investments
Sales Team Without Performance Coaching
The Challenge
Without live KPI data and personalized coaching plans, performance gaps go unaddressed and top performers carry underperformers indefinitely.
Our Solution
Layer AI-powered coaching recommendations directly into the sales KPI dashboard, driven by real-time performance data.
- +67% close rate improvement
- +71% appointment rate improvement
- +280% lead qualification improvement
Frequently Asked Questions About Business Performance Dashboards
Business performance dashboards generate consistent questions from home services operators and marketing leaders evaluating this type of investment. Below are the most important questions — answered directly based on the results and architecture from this engagement. Every metric cited reflects verified outcomes from the sourceMetrics for this case study.
Technology Stack
Frequently Asked Questions
A business performance dashboard is a centralized, real-time analytics interface that aggregates KPIs from sales, marketing, and operations into a single view. For home services companies, where lead volume, appointment rates, and close rates fluctuate daily, having live visibility into metrics like a 47.83% lead-to-appointment rate is the difference between proactive optimization and reactive firefighting weeks after problems occur.
The 99.9% uptime was achieved through a combination of streaming data pipelines, in-memory caching architecture, and redundant data source connections. The system was engineered with automated failover protocols and real-time health monitoring that detected and resolved infrastructure anomalies before they caused downtime — ensuring the business always had access to its critical performance data.
90% attribution accuracy means that 9 out of 10 customer conversions are correctly traced back to their originating marketing channel — whether that's organic search, paid ads, email, or referral. For a home services leader managing multiple acquisition channels and 40,000+ monthly email capacity, accurate attribution ensures marketing budget is allocated to what's actually driving revenue rather than guesswork.
A well-structured KPI dashboard eliminates information lag and gives sales managers real-time visibility into individual and team performance. In this case study, AI-powered coaching recommendations were surfaced directly through the dashboard, enabling personalized development plans based on live data. The result was a 67% improvement in close rates and a 71% improvement in appointment rates across the team.
A best-in-class business intelligence dashboard for home services should include lead volume and quality scores (the client tracked an average lead score of 85), lead-to-appointment rate (47.83% in this case), close rate performance, channel attribution accuracy, campaign ROI, and organic traffic trends. Layering in predictive analytics and automated alerts turns the dashboard from a reporting tool into an operational advantage.
The client achieved 300%+ overall ROI from the full engagement, which included the business performance dashboard as a core component. The SEO-integrated analytics tracking alone produced a 2,368% SEO ROI with 300% organic traffic growth. The dashboard directly enabled these results by giving the team the attribution clarity and real-time feedback loops needed to optimize spend and execution continuously.
For this regional home services client, the full dashboard infrastructure — including multi-tier role-based views, real-time data pipelines, automated alert systems, AI coaching integrations, and predictive analytics — was built and deployed across four sequential phases over approximately four months. Initial executive dashboard access was available within the first four weeks of implementation.
Related Case Studies
Ready to achieve similar results?
Get a custom growth plan backed by AI-powered systems that deliver measurable ROI from day one.
Start Your Growth Engine